Metrics-based Observability Guide
This guide provides comprehensive guidance on using Prometheus metrics from Karmada components to gain observability into your Karmada deployment. Following observability best practices, this guide will help you monitor the health, performance, and reliability of your multi-cluster environment.
Overview
Karmada exports rich Prometheus metrics across all its components, enabling you to monitor:
- Multi-cluster scheduling performance and reliability
- Resource propagation and synchronization health
- Cluster resource utilization and availability
- Failover and eviction operations
- Autoscaling behavior
All Karmada components expose metrics endpoints that can be scraped by Prometheus. This guide demonstrates how to leverage these metrics for effective observability.
Prerequisites
Before you begin, ensure you have:
- A running Karmada instance
- Prometheus installed and configured (see Use Prometheus to monitor Karmada control plane)
- Basic familiarity with Prometheus query language (PromQL)
- (Optional) Grafana for visualization
Quick Start
Get Karmada monitoring running in 5 minutes:
- Install Prometheus - Follow the setup guide to configure Prometheus scraping
- Import Grafana dashboards - Download and import the pre-built dashboards below for instant visibility
- Set up critical alerts - Copy the essential alerting rules to get notified of issues
- Verify monitoring works - Run the validation queries to confirm metrics are flowing
For comprehensive monitoring guidance, continue reading the sections below.
Karmada Metrics Architecture
Karmada exports Prometheus metrics from the following components:
- karmada-apiserver
- karmada-controller-manager
- karmada-scheduler
- karmada-scheduler-estimator
- karmada-agent
- karmada-webhook
- karmada-descheduler
For a complete list of available metrics, see the Karmada Metrics Reference.
Critical Metrics and Health Signals
This section covers the most important metrics for monitoring Karmada health. For the complete list of available metrics, see the Karmada Metrics Reference.
Priority Levels:
- ⚡ Critical - Monitor these first; essential for production operations
- ⚠️ Important - Add after critical metrics are in place
- 💡 Optional - Advanced monitoring and optimization
⚡ Critical Metrics (Monitor First)
cluster_ready_state
- Type: Gauge
- Labels:
member_cluster - Description: Indicates whether each member cluster is ready (1) or not ready (0).
- Why it matters: A cluster with value 0 cannot accept workload scheduling - this is the most critical health indicator.
- Example query:
# Show not-ready clusters
cluster_ready_state == 0
karmada_scheduler_schedule_attempts_total
- Type: Counter
- Labels:
result(success/error),schedule_type - Description: Count of scheduling attempts by result.
- Why it matters: High error rates mean workloads cannot be placed, blocking deployments.
- Example query:
# Scheduling success rate
rate(karmada_scheduler_schedule_attempts_total{result="success"}[5m])
  /
rate(karmada_scheduler_schedule_attempts_total[5m])
karmada_scheduler_e2e_scheduling_duration_seconds
- Type: Histogram
- Labels:
result,schedule_type - Description: End-to-end time to schedule a resource.
- Why it matters: High latency delays application deployments.
- Example query:
# P95 scheduling latency
histogram_quantile(0.95,
  rate(karmada_scheduler_e2e_scheduling_duration_seconds_bucket[5m]))
cluster_cpu_allocated_number
- Type: Gauge
- Labels:
member_cluster - Description: Number of CPU cores currently allocated (requested) in the cluster.
- Why it matters: Used with
cluster_cpu_allocatable_numberto calculate CPU utilization. High utilization (>85%) causes scheduling failures. - Example query:
# CPU utilization per cluster
(cluster_cpu_allocated_number / cluster_cpu_allocatable_number) * 100
cluster_cpu_allocatable_number
- Type: Gauge
- Labels:
member_cluster - Description: Total number of CPU cores available for allocation in the cluster.
- Why it matters: Represents cluster CPU capacity. Used with
cluster_cpu_allocated_numberto calculate utilization and available capacity. - Example query:
# Available CPU capacity by cluster
cluster_cpu_allocatable_number - cluster_cpu_allocated_number
cluster_memory_allocated_bytes
- Type: Gauge
- Labels:
member_cluster - Description: Amount of memory in bytes currently allocated (requested) in the cluster.
- Why it matters: Used with
cluster_memory_allocatable_bytesto calculate memory utilization. Memory exhaustion prevents new pod scheduling. - Example query:
# Memory utilization per cluster
(cluster_memory_allocated_bytes / cluster_memory_allocatable_bytes) * 100
cluster_memory_allocatable_bytes
- Type: Gauge
- Labels:
member_cluster - Description: Total amount of memory in bytes available for allocation in the cluster.
- Why it matters: Represents cluster memory capacity. Used with
cluster_memory_allocated_bytesto calculate utilization and available capacity. - Example query:
# Available memory in gigabytes by cluster
(cluster_memory_allocatable_bytes - cluster_memory_allocated_bytes) / 1024 / 1024 / 1024
karmada_work_sync_workload_duration_seconds
- Type: Histogram
- Labels:
result - Description: Time to sync Work objects to member clusters.
- Why it matters: Critical for end-to-end propagation latency - delays here delay all workload deployments.
- Example query:
# P95 work sync latency
histogram_quantile(0.95,
  rate(karmada_work_sync_workload_duration_seconds_bucket[5m]))
controller_runtime_webhook_requests_total
- Type: Counter
- Labels:
code(HTTP status),webhook - Description: Webhook request count by HTTP status code.
- Why it matters: Webhook failures block all API operations (creates, updates, deletes).
- Example query:
# Webhook error rate
sum(rate(controller_runtime_webhook_requests_total{code!~"2.."}[5m]))
  /
sum(rate(controller_runtime_webhook_requests_total[5m]))
⚠️ Important Metrics (Add After Critical)
scheduler_pending_bindings
- Type: Gauge
- Labels:
queue(active/backoff/unschedulable) - Description: Number of bindings in each queue.
- Why it matters: Bindings stuck in unschedulable queue indicate placement problems.
- Example query:
# Unschedulable bindings
scheduler_pending_bindings{queue="unschedulable"}
workqueue_depth
- Type: Gauge
- Labels:
name(controller name) - Description: Number of items in each controller's work queue.
- Why it matters: High/growing depth means controllers are falling behind.
- Example query:
# Controllers with deep queues
workqueue_depth > 100
karmada_eviction_queue_depth
- Type: Gauge
- Labels:
name - Description: Number of resources awaiting eviction during failover.
- Why it matters: Growing queue means failover is delayed.
- Example query:
# Eviction queue depth
karmada_eviction_queue_depth
resource_match_policy_duration_seconds
- Type: Histogram
- Description: Time to match resources to PropagationPolicies.
- Why it matters: First step in propagation pipeline - delays here cascade downstream.
- Example query:
# P95 policy matching latency
histogram_quantile(0.95,
  rate(resource_match_policy_duration_seconds_bucket[5m]))
karmada_policy_apply_attempts_total
- Type: Counter
- Labels:
result(success/error) - Description: Count of policy application attempts by result.
- Why it matters: Errors prevent resources from propagating.
- Example query:
# Policy application error rate
rate(karmada_policy_apply_attempts_total{result="error"}[5m])
  /
rate(karmada_policy_apply_attempts_total[5m])
create_resource_to_cluster
- Type: Counter
- Labels:
result,apiversion,kind,member_cluster - Description: Count of resource creation operations to member clusters by result.
- Why it matters: Errors indicate connectivity or permission issues when creating resources in member clusters.
- Example query:
# Resource creation error rate by cluster
sum by (member_cluster) (
  rate(create_resource_to_cluster{result="error"}[5m])
)
update_resource_to_cluster
- Type: Counter
- Labels:
result,apiversion,kind,member_cluster - Description: Count of resource update operations to member clusters by result.
- Why it matters: Errors indicate connectivity or permission issues when updating resources in member clusters.
- Example query:
# Resource update error rate by kind
sum by (kind) (
  rate(update_resource_to_cluster{result="error"}[5m])
)
delete_resource_from_cluster
- Type: Counter
- Labels:
result,apiversion,kind,member_cluster - Description: Count of resource deletion operations from member clusters by result.
- Why it matters: Errors indicate connectivity or permission issues when deleting resources from member clusters.
- Example query:
# Resource deletion error rate by cluster
sum by (member_cluster) (
  rate(delete_resource_from_cluster{result="error"}[5m])
)
workqueue_retries_total
- Type: Counter
- Labels:
name(controller name) - Description: Count of retries per controller.
- Why it matters: High retry rates indicate controller failures or transient issues.
- Example query:
# Retry ratio by controller
rate(workqueue_retries_total[5m])
  /
rate(workqueue_adds_total[5m])
💡 Optional Metrics (Advanced Monitoring)
cluster_ready_node_number
- Type: Gauge
- Labels:
member_cluster - Description: Number of nodes in Ready state in the cluster.
- Why it matters: Used with
cluster_node_numberto calculate node readiness ratio. A low ratio suggests node health issues that could impact workload capacity. - Example query:
# Node readiness ratio per cluster
(cluster_ready_node_number / cluster_node_number) < 0.8
cluster_node_number
- Type: Gauge
- Labels:
member_cluster - Description: Total number of nodes in the cluster.
- Why it matters: Represents total cluster node count. Used with
cluster_ready_node_numberto calculate node readiness ratio and track cluster size. - Example query:
# Total nodes across all clusters
sum(cluster_node_number)
karmada_federatedhpa_process_duration_seconds
- Type: Histogram
- Labels:
result - Description: FederatedHPA processing time.
- Why it matters: Indicates how quickly HPA decisions are made. High latency can delay scaling actions.
- Example query:
# P95 FederatedHPA processing latency
histogram_quantile(0.95,
  rate(karmada_federatedhpa_process_duration_seconds_bucket[5m]))
karmada_scheduler_estimator_estimating_request_total
- Type: Counter
- Labels:
result,type - Description: Scheduler estimator requests by result.
- Why it matters: Errors indicate the scheduler cannot accurately estimate cluster capacity, leading to poor placement decisions.
- Example query:
# Estimator error rate
rate(karmada_scheduler_estimator_estimating_request_total{result="error"}[5m])
  /
rate(karmada_scheduler_estimator_estimating_request_total[5m])
karmada_build_info
- Type: Gauge (constant value of 1)
- Labels:
git_version,git_commit,build_date,go_version,compiler,platform - Description: Component version information.
- Why it matters: Essential for tracking component versions and correlating issues with specific releases.
- Example query:
# List all component versions
karmada_build_info

# Check for version mismatches
count(karmada_build_info) by (git_version)
See the Karmada Metrics Reference for detailed information on all available metrics.
Grafana Dashboards
We provide production-ready Grafana dashboards that you can download and import immediately. These dashboards provide comprehensive observability coverage for all Karmada components and operations.
Dashboard Summary
| Dashboard | Purpose | Key Metrics | Download |
|---|---|---|---|
| API Server Insights | Monitor API server performance and resource usage | Request latency, error rates, etcd performance | 📥 JSON |
| Controller Manager Insights | Track controller reconciliation and workqueue health | Reconciliation errors, queue depth, worker utilization | 📥 JSON |
| Member Cluster Insights | Monitor cluster health and capacity | Cluster readiness, CPU/memory/pod utilization | 📥 JSON |
| Scheduler Insights | Track scheduling performance and plugin behavior | Scheduling latency, success rate, queue status | 📥 JSON |
| Resource Propagation Insights | Monitor resource propagation pipeline | Policy application, work sync duration, propagation errors | 📥 JSON |
Detailed Dashboard Descriptions
1. API Server Insights
📥 Download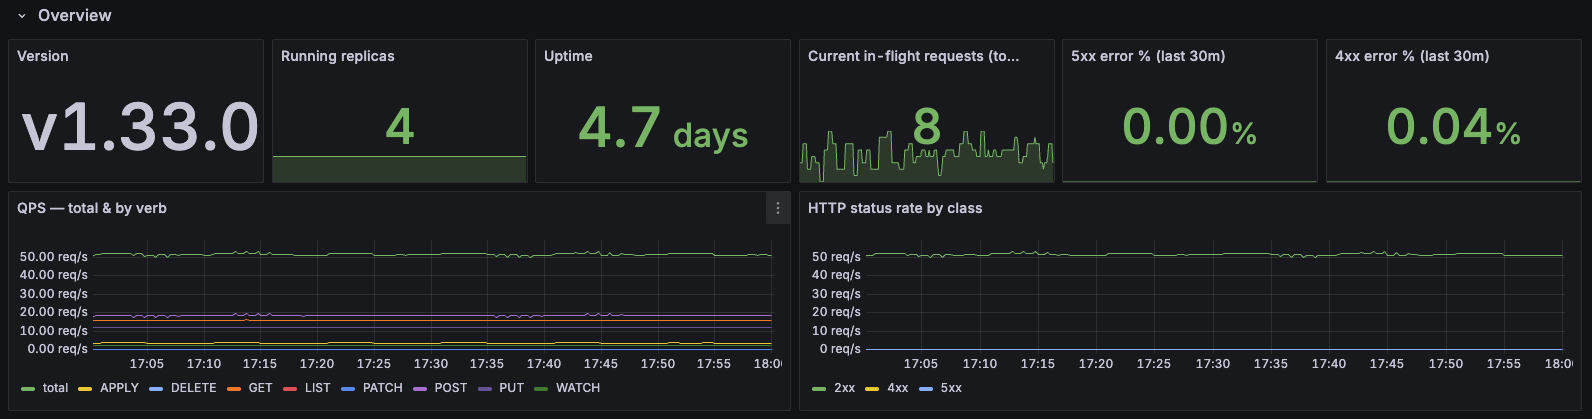
Purpose: Monitor Karmada API server performance, request patterns, and resource usage.
Note: Karmada is kube-native. As such, the Karmada API server is the standard Kubernetes API server. For detailed information about the metrics exposed, see the Kubernetes API Server Metrics documentation.
Dashboard Sections:
- Overview: Version, running replicas, uptime, in-flight requests, error rates (4xx/5xx)
- Request Latency: P50/P90/P99 latency overall and by verb, mutating vs read-only breakdown
- Request Mix & Hotspots: Top resources and API groups by QPS, request patterns
- Payload Sizes: Response size analysis and largest responses by resource
- Admission, Audit, Watches: Controller/webhook latency, audit events, watch events
- etcd: Request rates and latency by operation
- Go Runtime: CPU, memory, heap, GC, goroutines, threads, file descriptors
Use Case: API server performance tuning, capacity planning, troubleshooting slow requests, identifying resource hotspots
Recommended for: Platform engineering, performance optimization, API server capacity planning
2. Controller Manager Insights
📥 Download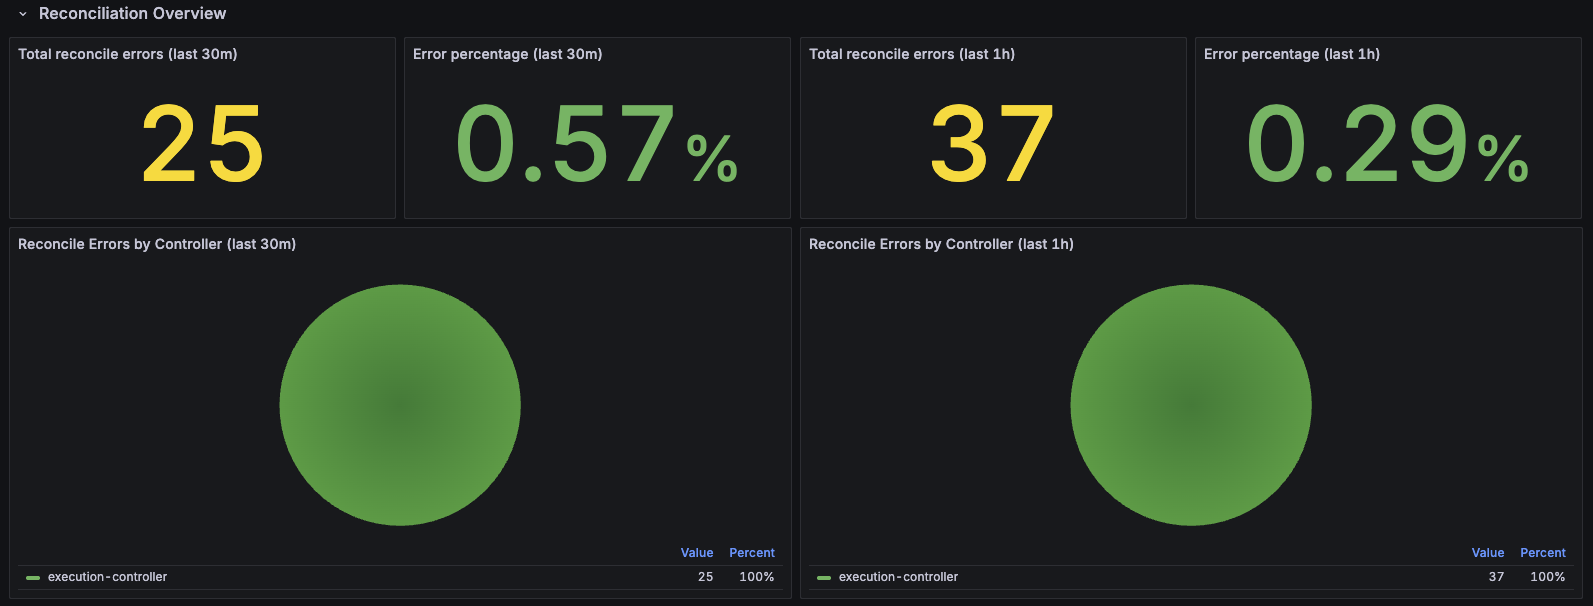
Purpose: Deep dive into controller-manager reconciliation, workqueue health, and runtime performance.
Dashboard Sections:
- Reconciliation Overview: Error counts and percentages (30m/1h windows), reconciliations per second by result, duration percentiles (P50/P90/P99), active workers, and worker utilization
- Workqueue Health: Queue depth, items added rate, queue wait time and work duration percentiles, unfinished work, retry rates
- Admission Webhooks: Webhook request rates and latency percentiles
- Go Runtime & Process: CPU, memory, heap, goroutines, threads, file descriptors
Features:
- Controller filtering: Filter by specific controllers to focus on individual controller performance
- Multi-time window analysis: View error rates over both 30-minute and 1-hour windows
- Workqueue health monitoring: Track queue depth, latency, and retry rates for early detection of issues
Use Case: Controller debugging, identifying reconciliation bottlenecks, webhook troubleshooting, detecting stuck controllers
Recommended for: Development, performance optimization, debugging controller issues
3. Member Cluster Insights
📥 Download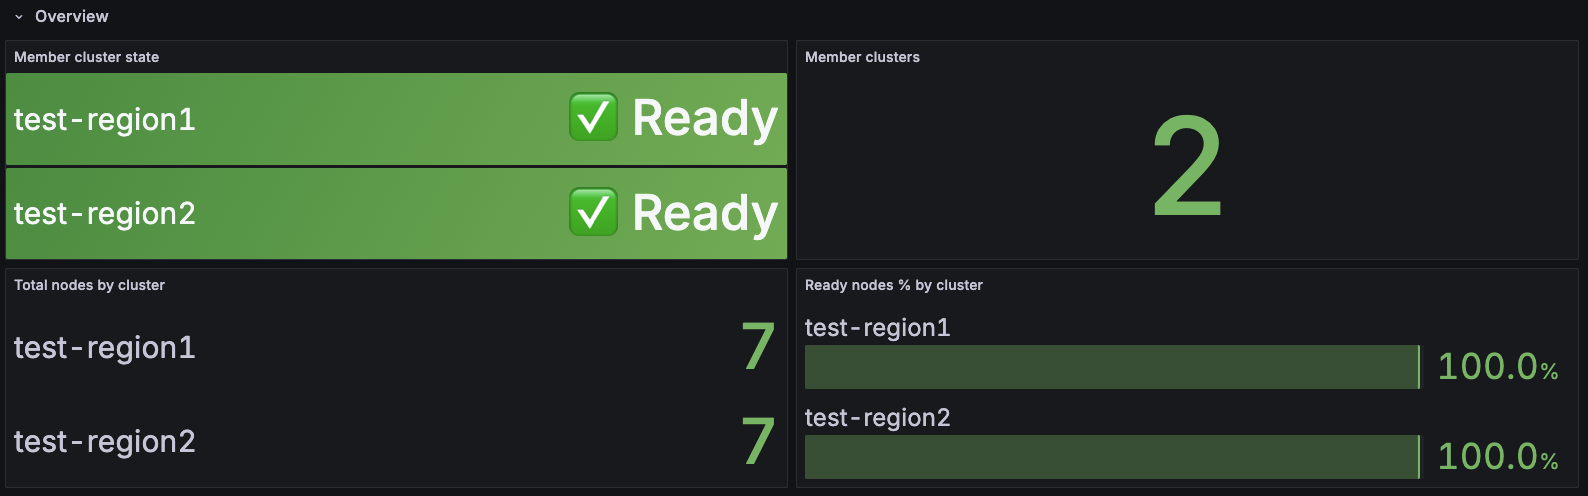
Purpose: Monitor health, capacity, and utilization of member clusters in your Karmada federation.
Dashboard Sections:
- Overview: Total/Ready/Not Ready cluster counts, health percentage, readiness status grid
- Capacity (Allocatable vs Allocated): CPU, Memory, and Pod capacity trends showing allocatable vs allocated resources over time
- Utilization % (Allocated / Allocatable): CPU, Memory, and Pod utilization percentages with color-coded thresholds
- Cluster Sync Status: Average and P95 cluster sync duration tracking
Features:
- Multi-cluster filtering: View all clusters or filter to specific ones
- Color-coded utilization: Green (<70%), Yellow (70-85%), Orange (85-95%), Red (>95%)
- Real-time capacity tracking: Compare allocatable vs allocated resources for capacity planning
- Health at a glance: Quickly identify unhealthy clusters and resource constraints
Use Case: Member cluster health monitoring, capacity planning, identifying resource bottlenecks, tracking cluster sync performance
Recommended for: Multi-cluster operations, capacity planning, cluster health checks, SRE teams
4. Scheduler Insights
📥 Download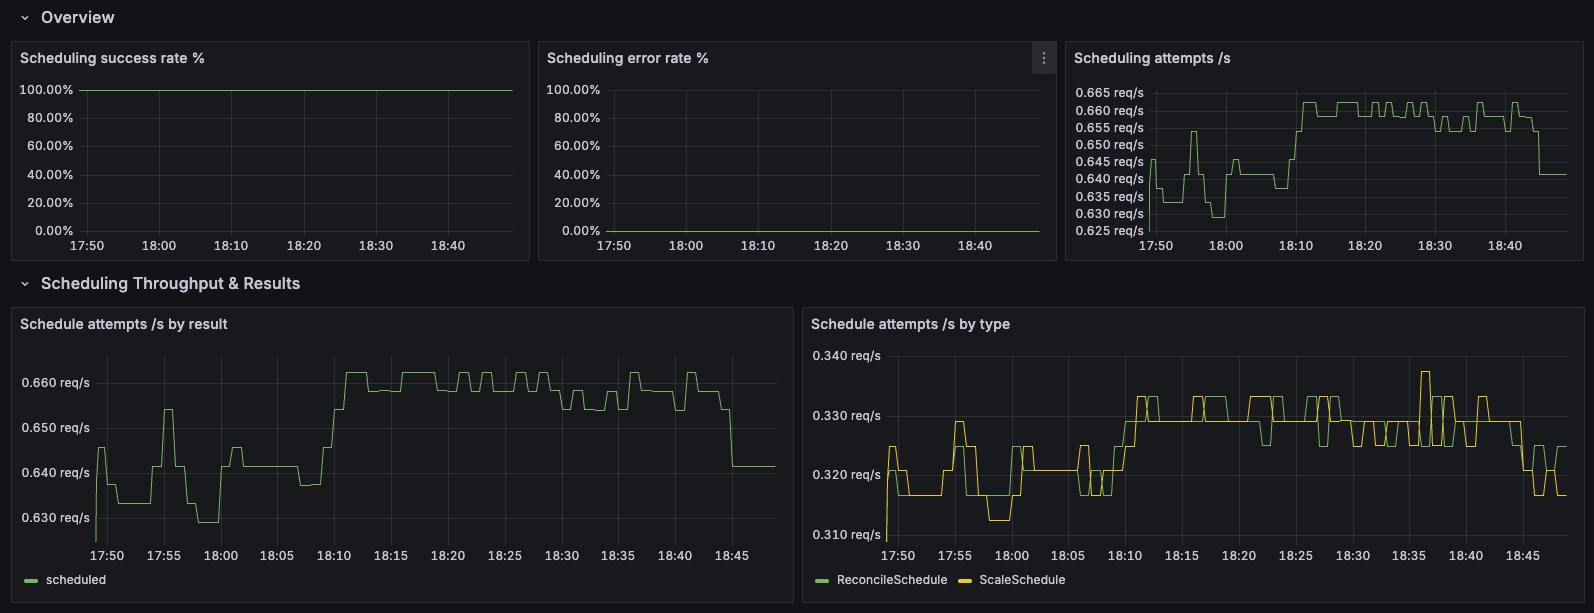
Purpose: Monitor Karmada scheduler performance, scheduling latency, algorithm efficiency, and plugin behavior.
Dashboard Sections:
- Overview: Total scheduling attempts, success/error counts, and success rate tracking
- Scheduling Throughput & Results: Scheduling attempts per second by result (success/error/unschedulable)
- E2E Scheduling Latency: End-to-end scheduling duration percentiles (P50/P90/P99) for overall performance tracking
- Algorithm & Queue: Scheduling algorithm latency, pending bindings by queue type, and queue incoming rate
- Framework Extension Points: Latency tracking for each extension point in the scheduling framework
- Plugin Execution: Plugin execution duration percentiles to identify slow plugins
- Breakdowns by Schedule Type: Detailed analysis segmented by schedule type (scale schedule, lazy activation, etc.)
Features:
- Multi-dimensional filtering: Filter by schedule type, result, event, extension point, and plugin
- Comprehensive latency analysis: Track latency at multiple stages (E2E, algorithm, framework, plugins)
- Queue health monitoring: Monitor pending bindings and queue incoming rates
- Plugin performance tracking: Identify slow or problematic scheduler plugins
Use Case: Scheduler performance optimization, troubleshooting slow scheduling, plugin development and debugging, capacity planning
Recommended for: Scheduler tuning, plugin developers, performance engineers, troubleshooting scheduling delays
5. Resource Propagation Insights
📥 Download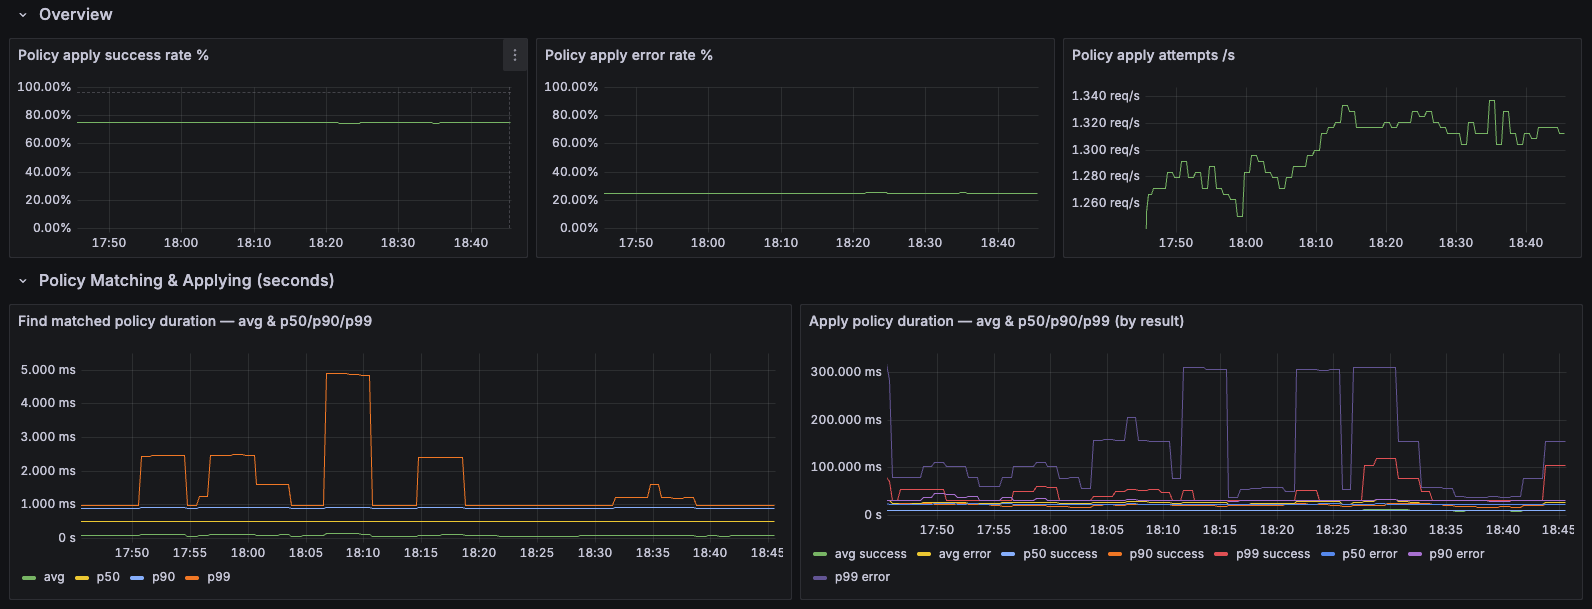
Purpose: Monitor the resource propagation pipeline from policy application to work synchronization across member clusters.
Dashboard Sections:
- Overview: Policy apply success/error rates, total apply rate, and overall propagation health
- Policy Matching & Applying: Average, P50, P90, and P99 latency for resource-to-policy matching operations
- Work Sync Durations: Latency percentiles for work synchronization to member clusters
Features:
- End-to-end propagation monitoring: Track the complete pipeline from policy application through work sync
- Multi-percentile latency tracking: P50/P90/P99 latency for detailed performance analysis
- Success vs error breakdown: Monitor both successful operations and error rates
Use Case: Troubleshooting propagation delays, identifying policy matching bottlenecks, monitoring cross-cluster deployment performance
Recommended for: Multi-cluster operations, policy debugging, performance optimization, propagation SLA monitoring
Installation
Prerequisites
- Grafana 8.0+ installed
- Prometheus datasource configured in Grafana
- Prometheus scraping Karmada component metrics (see setup guide)
Method 1: Import via Grafana UI
- Download the dashboard JSON file using the download links above
- Login to Grafana
- Navigate to Import:
- Click "Dashboards" in the left sidebar
- Click "New" → "Import"
- (Alternative: Click the Dashboards menu → "Import dashboard")
- Upload Dashboard:
- Click "Upload dashboard JSON file"
- Select the downloaded dashboard file
- Or paste the JSON content directly into the text area
- Configure Options:
- Name: Keep default or customize
- Folder: Select or create a "Karmada" folder
- UID: Keep default or customize (leave empty for auto-generation)
- Prometheus: Select your Prometheus datasource from the dropdown
- Import: Click "Import" button
- Repeat for each dashboard you want to install
Note: The exact navigation may vary slightly depending on your Grafana version. These instructions are for Grafana 9.0+.
Method 2: Provisioning (Recommended for Production)
For automated deployment, use Grafana's provisioning system:
-
Create provisioning directory:
mkdir -p /etc/grafana/provisioning/dashboards -
Create dashboard provider config (
/etc/grafana/provisioning/dashboards/karmada.yaml):apiVersion: 1
providers:
- name: 'Karmada'
orgId: 1
folder: 'Karmada'
type: file
disableDeletion: false
updateIntervalSeconds: 30
allowUiUpdates: true
options:
path: /var/lib/grafana/dashboards/karmada -
Copy dashboard files:
mkdir -p /var/lib/grafana/dashboards/karmada
cp *.json /var/lib/grafana/dashboards/karmada/ -
Restart Grafana:
systemctl restart grafana-server
Dashboard Best Practices
Organization and Scope
- Organize dashboards in folders:
Karmada/Overview,Karmada/Components,Karmada/Clusters,Karmada/Troubleshooting - Tag consistently:
karmada,multi-cluster,kubernetes, component names - Limit dashboard scope: Overview dashboards (4-6 key metrics), Component dashboards (single component), Domain dashboards (capacity, performance, troubleshooting)
- Clone before modifying: "Dashboard Name" → "Dashboard Name - Custom"
Visualization Types
Choose the right panel type for your data:
| Panel Type | Use For | Key Metrics Examples |
|---|---|---|
| Time Series | Trends over time | Scheduling latency (P50/P95/P99), sync duration, queue depth |
| Stat | Current values | Ready cluster count, current CPU utilization, error rate |
| Gauge | Percentages (0-100%) | Resource utilization, scheduling success rate |
| Bar Gauge | Multi-dimensional comparison | CPU usage per cluster, queue depth by controller |
| Table | Detailed data with sorting | Cluster inventory (status, CPU, memory, pods) |
| Heatmap | Distribution analysis | Latency distribution from histogram buckets |
Design Guidelines
Layout
- Top row: Critical metrics (health, error rates, alerts)
- Second row: Key performance indicators (latency, throughput)
- Bottom rows: Detailed breakdowns and debugging
- Standard panel widths: Full (24), Half (12), Third (8), Quarter (6)
Color Coding (use consistently across all dashboards)
- Green: Healthy (< 70% utilization, < 1% error rate)
- Yellow: Warning (70-85% utilization, 1-5% error rate)
- Orange: High (85-95% utilization, 5-10% error rate)
- Red: Critical (> 95% utilization, > 10% error rate)
Panel Titles
- Be specific: "Scheduling Success Rate (5m)" not "Graph 1"
- Include units: "Queue Depth (items)", "Latency (seconds)"
- Add descriptions for complex metrics
Query Optimization
Performance Best Practices
- Use recording rules for complex/frequently-used queries (see Recording Rules)
- Use
$__rate_intervalinstead of hardcoded[5m] - Always use
histogram_quantile()withrate()for percentiles - Limit high-cardinality series with
topk(10, ...)orbottomk(10, ...) - Set appropriate refresh intervals: Critical (30s-1m), Capacity planning (5m-10m), Historical (manual)
Example Query Optimizations
# Use topk to limit series
topk(10, rate(create_resource_to_cluster{result="error"}[5m]) by (kind))

# Aggregate when details aren't needed
sum by (member_cluster) (rate(create_resource_to_cluster[5m]))
Variables and Templating
Create reusable filter variables:
# Cluster filter
Name: cluster
Query: label_values(cluster_ready_state, member_cluster)
Multi-value: Yes, Include All: Yes

# Controller filter
Name: controller
Query: label_values(workqueue_depth, name)
Multi-value: Yes, Include All: Yes
Use in queries: cluster_cpu_allocated_number{member_cluster=~"$cluster"}
Alerting Integration
- Critical alerts: Define in Prometheus Alertmanager (cluster down, high error rates, webhook failures)
- Warning alerts: Can use Grafana (capacity warnings, latency degradation)
- Visualization: Add "Active Alerts" panel, use alert annotations on graphs, color-code panels with alerts
Cardinality Management
- High-cardinality labels (resource name, namespace): Use
topk()or aggregate - Medium-cardinality labels (cluster, controller, kind): Safe for most queries
- Low-cardinality labels (result, action, queue): Use freely
Multi-Cluster Best Practices
- Use bar gauges or tables for side-by-side cluster comparison
- Color-code by utilization/health to highlight outliers
- Show both absolute values and percentages
- Create separate dashboards for "Fleet Overview" vs "Single Cluster Detail"
Maintenance
- Use Grafana version history (Settings → Versions) to track changes
- Review dashboards quarterly - remove unused panels
- Export dashboards for backup; store JSON in git
- Update thresholds based on observed operational baselines
- Test with different time ranges and filter combinations before deployment
Common Pitfalls to Avoid
- ❌ Too many metrics on one dashboard (>15 panels)
- ❌ Inconsistent time ranges across related panels
- ❌ Missing units on axes
- ❌ Hardcoded cluster names or environment-specific values
- ❌ No visual indication of "good" vs "bad" values
- ❌ Auto-refresh on expensive queries
Example Prometheus Recording Rules
To improve query performance and simplify dashboards, define recording rules:
Click to expand Prometheus recording rules configuration
groups:
  - name: karmada_cluster_health
    interval: 30s
    rules:
      - record: karmada:cluster:ready:count
        expr: sum(cluster_ready_state)

      - record: karmada:cluster:cpu:utilization
        expr: |
          (cluster_cpu_allocated_number / cluster_cpu_allocatable_number) * 100

      - record: karmada:cluster:memory:utilization
        expr: |
          (cluster_memory_allocated_bytes / cluster_memory_allocatable_bytes) * 100

      - record: karmada:cluster:pod:utilization
        expr: |
          (cluster_pod_allocated_number / cluster_pod_allocatable_number) * 100

      - record: karmada:cluster:node:ready:ratio
        expr: |
          cluster_ready_node_number / cluster_node_number

  - name: karmada_scheduling
    interval: 30s
    rules:
      - record: karmada:scheduler:success:rate
        expr: |
          rate(karmada_scheduler_schedule_attempts_total{result="success"}[5m])
          /
          rate(karmada_scheduler_schedule_attempts_total[5m])

      - record: karmada:scheduler:latency:p95
        expr: |
          histogram_quantile(0.95,
            rate(karmada_scheduler_e2e_scheduling_duration_seconds_bucket[5m]))

      - record: karmada:scheduler:latency:p99
        expr: |
          histogram_quantile(0.99,
            rate(karmada_scheduler_e2e_scheduling_duration_seconds_bucket[5m]))

  - name: karmada_propagation
    interval: 30s
    rules:
      - record: karmada:propagation:binding_sync:p95
        expr: |
          histogram_quantile(0.95,
            rate(karmada_binding_sync_work_duration_seconds_bucket[5m]))

      - record: karmada:propagation:workload_sync:p95
        expr: |
          histogram_quantile(0.95,
            rate(karmada_work_sync_workload_duration_seconds_bucket[5m]))

      - record: karmada:propagation:policy_match:p95
        expr: |
          histogram_quantile(0.95,
            rate(resource_match_policy_duration_seconds_bucket[5m]))

      - record: karmada:propagation:error:rate
        expr: |
          sum(rate(create_resource_to_cluster{result="error"}[5m]))
          +
          sum(rate(update_resource_to_cluster{result="error"}[5m]))
          +
          sum(rate(delete_resource_from_cluster{result="error"}[5m]))

  - name: karmada_controller_health
    interval: 30s
    rules:
      - record: karmada:workqueue:depth
        expr: workqueue_depth

      - record: karmada:workqueue:queue_duration:p95
        expr: |
          histogram_quantile(0.95,
            rate(workqueue_queue_duration_seconds_bucket[5m]))

      - record: karmada:workqueue:retry:rate
        expr: |
          rate(workqueue_retries_total[5m])
          /
          rate(workqueue_adds_total[5m])

      - record: karmada:cluster_sync:latency:p95
        expr: |
          histogram_quantile(0.95,
            rate(cluster_sync_status_duration_seconds_bucket[5m]))
Verify Your Monitoring Setup
After setting up Prometheus and Grafana, run these queries to confirm everything is working correctly:
# 1. ✅ Metrics are being scraped from all components
up{job=~"karmada.*"}

# 2. ✅ All clusters are reporting metrics
count(cluster_ready_state) > 0

# 3. ✅ Scheduling metrics are being collected
rate(karmada_scheduler_schedule_attempts_total[5m]) > 0

# 4. ✅ Controller metrics are available
count(workqueue_depth) > 0

# 5. ✅ Propagation metrics are flowing
rate(karmada_work_sync_workload_duration_seconds_count[5m]) > 0
Expected results:
- Query 1: Should return
1for each Karmada component (controller-manager, scheduler, etc.) - Query 2: Should return the number of member clusters you have
- Query 3: Should return a positive number if scheduling is active
- Query 4: Should return the number of active controllers
- Query 5: Should return a positive number if resources are being propagated
If any query returns no data, check your Prometheus scrape configuration.
Alerting Rules
Click to expand complete alerting rules configuration
groups:
  - name: karmada_critical_alerts
    rules:
      # Alert when a member cluster goes down
      - alert: KarmadaClusterDown
        expr: cluster_ready_state == 0
        for: 2m
        labels:
          severity: critical
        annotations:
          summary: "Member cluster {{ $labels.member_cluster }} is not ready"
          description: "Cluster has been NotReady for >2 minutes. Workloads cannot be scheduled."

      # Alert on scheduling failures
      - alert: KarmadaSchedulingFailureRate
        expr: |
          rate(karmada_scheduler_schedule_attempts_total{result="error"}[5m])
          /
          rate(karmada_scheduler_schedule_attempts_total[5m]) > 0.05
        for: 5m
        labels:
          severity: critical
        annotations:
          summary: "High scheduling failure rate: {{ $value | humanizePercentage }}"
          description: "Workloads may not be deploying correctly."

      # Alert on scheduling latency
      - alert: KarmadaSchedulingLatencyHigh
        expr: |
          histogram_quantile(0.95,
            rate(karmada_scheduler_e2e_scheduling_duration_seconds_bucket[5m])) > 5
        for: 10m
        labels:
          severity: warning
        annotations:
          summary: "Karmada scheduler latency is high"
          description: "P95 scheduling latency is {{ $value | humanizeDuration }}. Deployments may be delayed."

      # Alert on resource capacity issues
      - alert: KarmadaClusterHighCPUUtilization
        expr: |
          (cluster_cpu_allocated_number / cluster_cpu_allocatable_number) > 0.85
        for: 10m
        labels:
          severity: warning
        annotations:
          summary: "Cluster {{ $labels.member_cluster }} has high CPU utilization"
          description: "CPU utilization is {{ $value | humanizePercentage }}. Consider scaling."

      - alert: KarmadaClusterHighMemoryUtilization
        expr: |
          (cluster_memory_allocated_bytes / cluster_memory_allocatable_bytes) > 0.85
        for: 10m
        labels:
          severity: warning
        annotations:
          summary: "Cluster {{ $labels.member_cluster }} has high memory utilization"
          description: "Memory utilization is {{ $value | humanizePercentage }}. Consider scaling."

      # Alert on webhook failures (blocks all API operations)
      - alert: KarmadaWebhookFailures
        expr: |
          sum(rate(controller_runtime_webhook_requests_total{code!~"2.."}[5m]))
          /
          sum(rate(controller_runtime_webhook_requests_total[5m])) > 0.01
        for: 5m
        labels:
          severity: critical
        annotations:
          summary: "Webhook failure rate: {{ $value | humanizePercentage }}"
          description: "API operations may be blocked."

      # Alert on propagation errors
      - alert: KarmadaPropagationErrors
        expr: |
          sum(rate(create_resource_to_cluster{result="error"}[5m]))
          + sum(rate(update_resource_to_cluster{result="error"}[5m]))
          + sum(rate(delete_resource_from_cluster{result="error"}[5m])) > 1
        for: 5m
        labels:
          severity: critical
        annotations:
          summary: "High propagation error rate"
          description: "Check member cluster connectivity and permissions."

      # Alert on workqueue backlog
      - alert: KarmadaWorkqueueDepthHigh
        expr: workqueue_depth > 100
        for: 15m
        labels:
          severity: warning
        annotations:
          summary: "Controller {{ $labels.name }} has high queue depth: {{ $value }}"
          description: "Controller may be overloaded or stuck."

      # Alert on unschedulable bindings
      - alert: KarmadaUnschedulableBindings
        expr: scheduler_pending_bindings{queue="unschedulable"} > 0
        for: 15m
        labels:
          severity: warning
        annotations:
          summary: "{{ $value }} bindings stuck in unschedulable queue"
          description: "Check cluster capacity and scheduling constraints."

      # Alert on policy matching latency
      - alert: KarmadaPolicyMatchingLatencyHigh
        expr: |
          histogram_quantile(0.95,
            rate(resource_match_policy_duration_seconds_bucket[5m])) > 1
        for: 10m
        labels:
          severity: warning
        annotations:
          summary: "Policy matching latency is high"
          description: "P95 policy matching latency is {{ $value | humanizeDuration }}. This delays the propagation pipeline."

      # Alert on eviction queue growth
      - alert: KarmadaEvictionQueueGrowing
        expr: deriv(karmada_eviction_queue_depth[10m]) > 0
        for: 15m
        labels:
          severity: warning
        annotations:
          summary: "Eviction queue is continuously growing"
          description: "Eviction queue is growing. Failover processing may be delayed."

      # Alert on eviction processing latency
      - alert: KarmadaEvictionProcessingLatencyHigh
        expr: |
          histogram_quantile(0.95,
            rate(karmada_eviction_processing_latency_seconds_bucket[5m])) > 10
        for: 10m
        labels:
          severity: warning
        annotations:
          summary: "Eviction processing latency is high"
          description: "P95 eviction latency is {{ $value | humanizeDuration }}. Failover may be delayed."

      # Alert on scheduler estimator failures
      - alert: KarmadaEstimatorFailureRate
        expr: |
          rate(karmada_scheduler_estimator_estimating_request_total{result="error"}[5m])
          /
          rate(karmada_scheduler_estimator_estimating_request_total[5m]) > 0.05
        for: 5m
        labels:
          severity: warning
        annotations:
          summary: "Scheduler estimator has high failure rate"
          description: "Estimator failure rate is {{ $value | humanizePercentage }}. Scheduling accuracy may be impacted."

      # Alert on controller retry rate
      - alert: KarmadaWorkqueueRetryRateHigh
        expr: |
          rate(workqueue_retries_total[5m])
          /
          rate(workqueue_adds_total[5m]) > 0.1
        for: 10m
        labels:
          severity: warning
        annotations:
          summary: "Controller {{ $labels.name }} has high retry rate"
          description: "Retry rate is {{ $value | humanizePercentage }}. Check for transient failures."

      # Alert on cluster sync latency
      - alert: KarmadaClusterSyncLatencyHigh
        expr: |
          histogram_quantile(0.95,
            rate(cluster_sync_status_duration_seconds_bucket[5m])) > 10
        for: 10m
        labels:
          severity: warning
        annotations:
          summary: "Cluster status sync latency is high"
          description: "P95 cluster sync latency for {{ $labels.member_cluster }} is {{ $value | humanizeDuration }}."

      # Alert on HPA reconciliation errors
      - alert: KarmadaHPAReconciliationErrors
        expr: |
          sum(rate(horizontal_pod_autoscaler_controller_reconciliations_total{error!="none"}[5m]))
          /
          sum(rate(horizontal_pod_autoscaler_controller_reconciliations_total[5m])) > 0.05
        for: 10m
        labels:
          severity: warning
        annotations:
          summary: "HPA controller has high error rate"
          description: "HPA reconciliation error rate is {{ $value | humanizePercentage }}. Check FederatedHPA configurations."

  - name: karmada_capacity_alerts
    rules:
      # Critical capacity alerts at 95%
      - alert: KarmadaClusterApproachingCPUCapacity
        expr: |
          (cluster_cpu_allocated_number / cluster_cpu_allocatable_number) > 0.95
        for: 5m
        labels:
          severity: critical
        annotations:
          summary: "Cluster {{ $labels.member_cluster }} approaching CPU capacity"
          description: "CPU utilization is {{ $value | humanizePercentage }}. Immediate action required."

      - alert: KarmadaClusterApproachingMemoryCapacity
        expr: |
          (cluster_memory_allocated_bytes / cluster_memory_allocatable_bytes) > 0.95
        for: 5m
        labels:
          severity: critical
        annotations:
          summary: "Cluster {{ $labels.member_cluster }} approaching memory capacity"
          description: "Memory utilization is {{ $value | humanizePercentage }}. Immediate action required."

      - alert: KarmadaClusterApproachingPodCapacity
        expr: |
          (cluster_pod_allocated_number / cluster_pod_allocatable_number) > 0.95
        for: 5m
        labels:
          severity: critical
        annotations:
          summary: "Cluster {{ $labels.member_cluster }} approaching pod capacity"
          description: "Pod utilization is {{ $value | humanizePercentage }}. Immediate action required."

      # Alert on unhealthy nodes
      - alert: KarmadaClusterNodeUnhealthy
        expr: |
          (cluster_ready_node_number / cluster_node_number) < 0.8
        for: 5m
        labels:
          severity: warning
        annotations:
          summary: "Cluster {{ $labels.member_cluster }} has unhealthy nodes"
          description: "Only {{ $value | humanizePercentage }} of nodes are ready. Investigate node health."
Note: The alerts above use full PromQL expressions for clarity. For production deployments, you can simplify many of these alerts using recording rules. For example:
# Instead of:
expr: |
  (cluster_cpu_allocated_number / cluster_cpu_allocatable_number) > 0.85

# Use the recording rule:
expr: karmada:cluster:cpu:utilization > 85
This reduces query complexity and improves Prometheus performance. See the recording rules section for all available pre-computed metrics.
Observability Best Practices for Karmada
1. Use the Four Golden Signals
Apply the Four Golden Signals framework to Karmada:
- Latency: Monitor scheduling, propagation, and sync latencies
- Traffic: Track scheduling rate, resource operation rate
- Errors: Monitor error rates for scheduling, propagation, eviction
- Saturation: Track cluster resource utilization, queue depths
2. Monitor by Service Level Objectives (SLOs)
Define SLOs for critical operations based on your operational requirements:
- Scheduling SLO: Define acceptable success rates and latency targets for scheduling attempts
- Propagation SLO: Establish latency targets for resource updates syncing to member clusters
- Cluster Health SLO: Set uptime targets for member cluster availability
- Failover SLO: Define acceptable completion times for eviction operations during failover
Establish these SLOs based on your application requirements, user expectations, and operational baselines observed in your environment.
3. Implement Multi-layer Monitoring
Monitor at different abstraction levels:
- Infrastructure: Node health, network connectivity
- Platform: Cluster readiness, resource capacity
- Control Plane: Scheduler, controller performance
- Application: Workload propagation, sync status
4. Use Cardinality-Aware Practices
Be mindful of metric cardinality:
- Use recording rules to pre-aggregate high-cardinality metrics
- Consider using metric relabeling to drop unnecessary labels
5. Establish Baseline Behavior
Before setting alerts:
- Collect metrics for at least 1-2 weeks
- Analyze normal operating patterns
- Set alert thresholds based on observed baselines
- Account for daily/weekly patterns
- Review and tune alerts regularly
6. Correlate Metrics with Events
Combine metrics with Karmada events (see Event Reference):
- Use events to understand context behind metric anomalies
- Track event rates alongside metrics
7. Monitor End-to-End Latency
Track the complete propagation pipeline:
Policy Match → Policy Apply → Binding Sync → Work Sync → Resource Creation
Create composite metrics that measure total time from resource creation to successful deployment.
8. Automate Runbooks
Link alerts to runbooks that include:
- What the alert means
- Immediate mitigation steps
- Investigation queries
- Escalation paths
9. Regular Review and Refinement
- Review dashboard usage monthly
- Remove unused metrics and panels
- Consolidate overlapping alerts
- Update thresholds based on operational experience
Troubleshooting with Metrics
Scenario 1: Workloads Not Deploying
Symptoms: Users report workloads not appearing in member clusters
Investigation steps:
-
Check scheduling success rate:
karmada:scheduler:success:rate -
If scheduling failing, check queue status:
scheduler_pending_bindings -
Check policy matching (first step):
# Check if policy matching is slow
histogram_quantile(0.95, rate(resource_match_policy_duration_seconds_bucket[5m])) -
Check policy application:
rate(karmada_policy_apply_attempts_total{result="error"}[5m]) -
Check work synchronization:
rate(karmada_work_sync_workload_duration_seconds_count{result="error"}[5m]) -
Check resource creation to clusters:
rate(create_resource_to_cluster{result="error"}[5m]) by (member_cluster, kind) -
Check webhook errors (can block operations):
rate(controller_runtime_webhook_requests_total{code!~"2.."}[5m]) by (webhook)
Scenario 2: Slow Scheduling
Symptoms: Workloads take long time to be scheduled
Investigation steps:
-
Check overall scheduling latency:
karmada:scheduler:latency:p95 -
Identify slow scheduling steps:
histogram_quantile(0.95,
  rate(karmada_scheduler_scheduling_algorithm_duration_seconds_bucket[5m]))
by (schedule_step) -
Identify slow plugins:
topk(5,
  histogram_quantile(0.95,
    rate(karmada_scheduler_plugin_execution_duration_seconds_bucket[5m]))
by (plugin)) -
Check estimator performance:
histogram_quantile(0.95,
  rate(karmada_scheduler_estimator_estimating_algorithm_duration_seconds_bucket[5m]))
Scenario 3: Cluster Capacity Issues
Symptoms: Scheduling failures due to insufficient resources
Investigation steps:
-
Identify constrained clusters:
# CPU constrained
karmada:cluster:cpu:utilization > 90

# Memory constrained
karmada:cluster:memory:utilization > 90

# Pod capacity constrained
karmada:cluster:pod:utilization > 90 -
Check if new nodes are needed:
cluster_node_number -
Identify workload distribution:
cluster_pod_allocated_number
Scenario 4: Failover Not Working
Symptoms: Workloads not failing over when cluster goes down
Investigation steps:
-
Check eviction queue:
karmada_eviction_queue_depth -
Check eviction processing:
rate(karmada_eviction_processing_total[5m]) by (result) -
Check eviction latency:
histogram_quantile(0.95,
rate(karmada_eviction_processing_latency_seconds_bucket[5m])) -
Identify stuck evictions:
karmada_eviction_kind_total
Scenario 5: Controller Performance Issues
Symptoms: Controllers are slow to respond to changes, high processing delays
Investigation steps:
-
Check workqueue depth:
# Identify controllers with high queue depth
workqueue_depth > 50 -
Check workqueue latency:
# P95 time items spend in queue before processing
histogram_quantile(0.95,
rate(workqueue_queue_duration_seconds_bucket[5m])) by (name) -
Check retry rates:
# High retry rates indicate failures
rate(workqueue_retries_total[5m]) / rate(workqueue_adds_total[5m]) by (name) -
Check controller-specific metrics:
# For cluster controller
histogram_quantile(0.95,
  rate(cluster_sync_status_duration_seconds_bucket[5m])) by (member_cluster)
Scenario 6: Autoscaling Not Working
Symptoms: FederatedHPA not scaling workloads appropriately
Investigation steps:
-
Check HPA reconciliation errors:
rate(horizontal_pod_autoscaler_controller_reconciliations_total{error!="none"}[5m])
by (action, error) -
Check metric computation issues:
# Identify which metric types are failing
rate(horizontal_pod_autoscaler_controller_metric_computation_total{error!="none"}[5m])
by (metric_type, error) -
Check metric pull latency:
# High latency delays scaling decisions
histogram_quantile(0.95,
  rate(karmada_federatedhpa_pull_metrics_duration_seconds_bucket[5m]))
by (metricType) -
For CronFederatedHPA, check rule processing:
histogram_quantile(0.95,
  rate(cronfederatedhpa_rule_process_duration_seconds_bucket[5m]))
PromQL Query Reference
This section provides ready-to-use PromQL queries for common Karmada monitoring scenarios. Copy and paste these into Grafana panels or Prometheus queries.
Cluster Health Queries
Cluster Status
# Total ready clusters
sum(cluster_ready_state)

# List of not-ready clusters
cluster_ready_state == 0

# Cluster readiness over time
cluster_ready_state
Node Health
# Node readiness ratio per cluster
cluster_ready_node_number / cluster_node_number

# Clusters with less than 80% ready nodes
(cluster_ready_node_number / cluster_node_number) < 0.8

# Total nodes across all clusters
sum(cluster_node_number)
Resource Utilization Queries
CPU Utilization
# CPU utilization percentage by cluster
(cluster_cpu_allocated_number / cluster_cpu_allocatable_number) * 100

# Clusters with high CPU utilization (>85%)
(cluster_cpu_allocated_number / cluster_cpu_allocatable_number) > 0.85

# Available CPU capacity by cluster
cluster_cpu_allocatable_number - cluster_cpu_allocated_number

# Total CPU allocated across all clusters
sum(cluster_cpu_allocated_number)
Memory Utilization
# Memory utilization percentage by cluster
(cluster_memory_allocated_bytes / cluster_memory_allocatable_bytes) * 100

# Clusters with high memory utilization (>85%)
(cluster_memory_allocated_bytes / cluster_memory_allocatable_bytes) > 0.85

# Available memory in gigabytes by cluster
(cluster_memory_allocatable_bytes - cluster_memory_allocated_bytes) / 1024 / 1024 / 1024

# Total memory allocated in gigabytes
sum(cluster_memory_allocated_bytes) / 1024 / 1024 / 1024
Pod Capacity
# Pod utilization percentage by cluster
(cluster_pod_allocated_number / cluster_pod_allocatable_number) * 100

# Clusters approaching pod capacity (>90%)
(cluster_pod_allocated_number / cluster_pod_allocatable_number) > 0.9

# Available pod slots by cluster
cluster_pod_allocatable_number - cluster_pod_allocated_number
Scheduling Performance Queries
Scheduling Success Rate
# Overall scheduling success rate (5-minute window)
rate(karmada_scheduler_schedule_attempts_total{result="success"}[5m])
  /
rate(karmada_scheduler_schedule_attempts_total[5m])

# Scheduling error rate
rate(karmada_scheduler_schedule_attempts_total{result="error"}[5m])
  /
rate(karmada_scheduler_schedule_attempts_total[5m])

# Scheduling attempts per second
rate(karmada_scheduler_schedule_attempts_total[5m])
Scheduling Latency
# P50 scheduling latency (median)
histogram_quantile(0.50, rate(karmada_scheduler_e2e_scheduling_duration_seconds_bucket[5m]))

# P95 scheduling latency
histogram_quantile(0.95, rate(karmada_scheduler_e2e_scheduling_duration_seconds_bucket[5m]))

# P99 scheduling latency (worst case)
histogram_quantile(0.99, rate(karmada_scheduler_e2e_scheduling_duration_seconds_bucket[5m]))
Scheduling Algorithm Performance
# Latency by scheduling step (P95)
histogram_quantile(0.95,
  rate(karmada_scheduler_scheduling_algorithm_duration_seconds_bucket[5m]))
  by (schedule_step)

# Slowest plugins (Top 10, P95)
topk(10,
  histogram_quantile(0.95,
    rate(karmada_scheduler_plugin_execution_duration_seconds_bucket[5m]))
    by (plugin))

# Extension point latency (P95)
histogram_quantile(0.95,
  rate(karmada_scheduler_framework_extension_point_duration_seconds_bucket[5m]))
  by (extension_point)
Scheduler Queue Status
# Pending bindings by queue type
scheduler_pending_bindings

# Unschedulable bindings (need attention)
scheduler_pending_bindings{queue="unschedulable"}

# Bindings in backoff queue
scheduler_pending_bindings{queue="backoff"}

# Queue incoming rate by event type
rate(karmada_scheduler_queue_incoming_bindings_total[5m]) by (event)
Propagation and Sync Queries
Policy Matching and Application
# P95 policy matching latency
histogram_quantile(0.95, rate(resource_match_policy_duration_seconds_bucket[5m]))

# Policy application error rate
rate(karmada_policy_apply_attempts_total{result="error"}[5m])
  /
rate(karmada_policy_apply_attempts_total[5m])

# Policy preemption rate
rate(policy_preemption_total[5m]) by (result)
Work Synchronization
# P95 binding-to-work sync latency
histogram_quantile(0.95, rate(karmada_binding_sync_work_duration_seconds_bucket[5m]))

# P95 work-to-cluster sync latency
histogram_quantile(0.95, rate(karmada_work_sync_workload_duration_seconds_bucket[5m]))

# Work sync error rate
rate(karmada_work_sync_workload_duration_seconds_count{result="error"}[5m])
  /
rate(karmada_work_sync_workload_duration_seconds_count[5m])
Resource Operations to Clusters
# Resource creation error rate by cluster
sum by (member_cluster) (
  rate(create_resource_to_cluster{result="error"}[5m])
)

# Resource update error rate by kind
sum by (kind) (
  rate(update_resource_to_cluster{result="error"}[5m])
)

# Total resource operations per second
sum(rate(create_resource_to_cluster[5m]))
+ sum(rate(update_resource_to_cluster[5m]))
+ sum(rate(delete_resource_from_cluster[5m]))

# Operations by result (success vs error)
sum by (result) (
  rate(create_resource_to_cluster[5m])
  + rate(update_resource_to_cluster[5m])
  + rate(delete_resource_from_cluster[5m])
)
Failover and Eviction Queries
Eviction Queue
# Current eviction queue depth
karmada_eviction_queue_depth

# Rate of change in queue depth (growing = backlog)
deriv(karmada_eviction_queue_depth[5m])

# Resources in eviction queue by kind and cluster
karmada_eviction_kind_total

# Resources by kind across all clusters
sum by (resource_kind) (karmada_eviction_kind_total)
Eviction Processing
# P95 eviction processing latency
histogram_quantile(0.95,
  rate(karmada_eviction_processing_latency_seconds_bucket[5m]))

# Eviction success rate
rate(karmada_eviction_processing_total{result="success"}[5m])
  /
rate(karmada_eviction_processing_total[5m])

# Evictions processed per second
rate(karmada_eviction_processing_total[5m])
Controller Health Queries
Workqueue Metrics
# Workqueue depth by controller
workqueue_depth

# Controllers with deep queues (>100 items)
workqueue_depth > 100

# P95 queue wait time by controller
histogram_quantile(0.95,
  rate(workqueue_queue_duration_seconds_bucket[5m]))
  by (name)

# Workqueue add rate (incoming work)
rate(workqueue_adds_total[5m]) by (name)

# Workqueue retry rate
rate(workqueue_retries_total[5m]) by (name)

# Retry ratio (should be <10%)
rate(workqueue_retries_total[5m])
  /
rate(workqueue_adds_total[5m])
Reconciliation Performance
# P95 reconciliation duration by controller
histogram_quantile(0.95,
  rate(workqueue_work_duration_seconds_bucket[5m]))
  by (name)

# Oldest unfinished work (stuck items)
workqueue_unfinished_work_seconds

# Controllers with stuck items (>60 seconds)
workqueue_unfinished_work_seconds > 60
Cluster Status Sync
# P95 cluster status sync latency
histogram_quantile(0.95,
  rate(cluster_sync_status_duration_seconds_bucket[5m]))
  by (member_cluster)

# Slow cluster syncs (>10 seconds)
histogram_quantile(0.95,
  rate(cluster_sync_status_duration_seconds_bucket[5m]))
  by (member_cluster) > 10
Autoscaling Queries
FederatedHPA
# P95 FederatedHPA processing latency
histogram_quantile(0.95,
  rate(karmada_federatedhpa_process_duration_seconds_bucket[5m]))

# P95 metrics pull latency by type
histogram_quantile(0.95,
  rate(karmada_federatedhpa_pull_metrics_duration_seconds_bucket[5m]))
  by (metricType)

# FederatedHPA processing error rate
rate(karmada_federatedhpa_process_duration_seconds_count{result="error"}[5m])
  /
rate(karmada_federatedhpa_process_duration_seconds_count[5m])
HPA Controller
# HPA reconciliation error rate
sum(rate(horizontal_pod_autoscaler_controller_reconciliations_total{error!="none"}[5m]))
  /
sum(rate(horizontal_pod_autoscaler_controller_reconciliations_total[5m]))

# HPA reconciliations by action
rate(horizontal_pod_autoscaler_controller_reconciliations_total[5m])
  by (action)

# Metric computation errors by type
rate(horizontal_pod_autoscaler_controller_metric_computation_total{error!="none"}[5m])
  by (metric_type, error)

# P95 metric computation latency by type
histogram_quantile(0.95,
  rate(horizontal_pod_autoscaler_controller_metric_computation_duration_seconds_bucket[5m]))
  by (metric_type)
Webhook Queries
# Webhook request rate by status code
rate(controller_runtime_webhook_requests_total[5m])
  by (webhook, code)

# Webhook error rate
sum(rate(controller_runtime_webhook_requests_total{code!~"2.."}[5m]))
  /
sum(rate(controller_runtime_webhook_requests_total[5m]))

# Failing webhooks (by name)
sum by (webhook) (
  rate(controller_runtime_webhook_requests_total{code!~"2.."}[5m])
)
Scheduler Estimator Queries
# Estimator error rate
rate(karmada_scheduler_estimator_estimating_request_total{result="error"}[5m])
  /
rate(karmada_scheduler_estimator_estimating_request_total[5m])

# P95 estimation latency by step
histogram_quantile(0.95,
  rate(karmada_scheduler_estimator_estimating_algorithm_duration_seconds_bucket[5m]))
  by (step)

# Estimation requests per second
rate(karmada_scheduler_estimator_estimating_request_total[5m])
Component Version Queries
# List all component versions
karmada_build_info

# Count components by version
count by (git_version) (karmada_build_info)

# Components running specific version
karmada_build_info{git_version="v1.11.0"}

# Check for version mismatches
count(count by (git_version) (karmada_build_info)) > 1
Alerting Queries
These queries are designed for alerting rules:
# Critical: Cluster down for >2 minutes
cluster_ready_state == 0

# Warning: High CPU utilization for >10 minutes
(cluster_cpu_allocated_number / cluster_cpu_allocatable_number) > 0.85

# Critical: Scheduling failure rate >5% for >5 minutes
(
  rate(karmada_scheduler_schedule_attempts_total{result="error"}[5m])
  /
  rate(karmada_scheduler_schedule_attempts_total[5m])
) > 0.05

# Warning: Workqueue depth high for >15 minutes
workqueue_depth > 100

# Critical: Webhook failures >1% for >5 minutes
(
  sum(rate(controller_runtime_webhook_requests_total{code!~"2.."}[5m]))
  /
  sum(rate(controller_runtime_webhook_requests_total[5m]))
) > 0.01

# Warning: Eviction queue growing for >15 minutes
deriv(karmada_eviction_queue_depth[10m]) > 0

# Warning: Unschedulable bindings for >15 minutes
scheduler_pending_bindings{queue="unschedulable"} > 0
Aggregation Examples
Multi-Cluster Aggregations
# Total CPU allocated across all clusters
sum(cluster_cpu_allocated_number)

# Average CPU utilization across clusters
avg(cluster_cpu_allocated_number / cluster_cpu_allocatable_number)

# Number of clusters with high CPU usage (>85%)
count((cluster_cpu_allocated_number / cluster_cpu_allocatable_number) > 0.85)

# Maximum memory utilization across any cluster
max(cluster_memory_allocated_bytes / cluster_memory_allocatable_bytes)
Time-based Aggregations
# Average scheduling latency over 1 hour
avg_over_time(
  histogram_quantile(0.95,
    rate(karmada_scheduler_e2e_scheduling_duration_seconds_bucket[5m]))[1h:])

# Max queue depth in last 24 hours
max_over_time(workqueue_depth[24h])

# Growth rate of allocated CPU over 6 hours
(
  cluster_cpu_allocated_number
  -
  cluster_cpu_allocated_number offset 6h
)
Tips and Tricks
Using Label Filters
# Filter by specific cluster
cluster_cpu_allocated_number{member_cluster="cluster-01"}

# Filter multiple clusters
cluster_cpu_allocated_number{member_cluster=~"cluster-01|cluster-02"}

# Exclude specific clusters
cluster_cpu_allocated_number{member_cluster!~"test-.*"}
Combining Metrics
# Total propagation error rate
(
  sum(rate(create_resource_to_cluster{result="error"}[5m]))
  + sum(rate(update_resource_to_cluster{result="error"}[5m]))
  + sum(rate(delete_resource_from_cluster{result="error"}[5m]))
)
/
(
  sum(rate(create_resource_to_cluster[5m]))
  + sum(rate(update_resource_to_cluster[5m]))
  + sum(rate(delete_resource_from_cluster[5m]))
)
Using Recording Rules
# Instead of complex queries, reference recording rules:
karmada:cluster:cpu:utilization
karmada:scheduler:success:rate
karmada:propagation:error:rate

# See the recording rules section for definitions
Next Steps
- Set up Prometheus to scrape Karmada component metrics (see Use Prometheus to monitor Karmada control plane)
- Import or create the recommended dashboards in Grafana
- Configure recording rules for improved query performance
- Set up alerting rules based on your SLOs
- Integrate with your incident management system
- Review and refine dashboards and alerts based on operational experience
Additional Resources
- Karmada Metrics Reference - Complete list of all available metrics
- Karmada Event Reference - Event types and meanings
- Working with Prometheus in Control Plane - Prometheus setup guide
- Prometheus Best Practices - Upstream Prometheus documentation
- Google SRE Book - Monitoring Distributed Systems - Foundational monitoring principles